
Introduction: Why Volume Profile Matters More Than Indicators
Most retail traders rely on lagging indicators—MACD, RSI, moving averages—without understanding where real money is actually transacted.
Volume Profile changes that.
Instead of analyzing price over time, volume profile organizes volume by price, revealing:
- Where institutions agreed on value
- Where liquidity is thin
- Where price is likely to stall—or accelerate
When volume profile is combined with options Greeks and dealer hedging mechanics, it becomes a complete market structure framework for both day traders and swing traders.
This guide breaks down:
- Volume profile concepts that actually matter
- High-probability trading strategies
- How to integrate delta, gamma, vanna, charm, theta, and open interest
- How professionals anticipate market behavior instead of reacting late
What Is Volume Profile Analysis?


Volume Profile shows how much volume traded at each price level over a given period.
Core Volume Profile Components
Point of Control (POC)
The price where the most volume traded.
Represents maximum market agreement.
Value Area (VAH / VAL)
The range containing ~70% of total volume.
This is where the market considers price “fair.”
High Volume Nodes (HVNs)
Areas of heavy participation and balance.
Expect consolidation and mean reversion.
Low Volume Nodes (LVNs)
Areas of rejection and poor participation.
Expect fast price movement.
Markets move slowly through agreement and quickly through disagreement.
Auction Market Theory: The Foundation of Volume Profile
Volume profile works because markets behave as auctions, not random price series.
The auction process:
- Price explores
- Participation increases or fails
- Value forms or price rejects
- Price moves to the next area of interest
Balance vs Imbalance
Balanced Market
- Overlapping value
- Strong HVNs
- Mean reversion behavior
Imbalanced Market
- Value migration
- LVN acceptance
- Directional expansion
This distinction explains why most breakouts fail inside value and why real trends begin outside it.
Key Volume Profile Structures Traders Must Understand
High Volume Nodes (HVNs)
- Heavy inventory
- Dealer comfort
- Price slows and rotates
Best used for:
Range trading and POC reversion setups.
Low Volume Nodes (LVNs)
- Thin liquidity
- Poor auction participation
- Price moves fast
Best used for:
Continuation trades, not fades.
LVNs are acceleration zones—not support or resistance.
Double Distribution Profiles
- Two separate value areas
- Often created by news or gamma regime changes
If price re-enters the LVN between distributions, rotation to the opposite value area is likely.
Volume Profile Day Trading Strategies


4
Strategy 1: POC Reversion (Balanced Conditions)
Market Environment
- Overlapping value
- Low volatility
- Long-gamma dealer positioning
Execution
- Fade VAH or VAL
- Target POC
- Tight stops outside value
Strategy 2: LVN Acceptance Break
Market Environment
- Value break
- Volume expansion
- Short-gamma conditions
Execution
- Enter on acceptance beyond LVN
- Target next HVN or value edge
- No fading inside LVNs
Strategy 3: Trend Day via Value Migration
Market Environment
- Single prints remain intact
- Value shifts session-to-session
Execution
- Trade pullbacks toward developing HVNs or VWAP
- Avoid counter-trend fades
Swing Trading With Volume Profile


Anchored Volume Profile (AVP)
Anchor volume from:
- Major highs or lows
- Earnings events
- Macro news releases
- Trend inflection points
Institutions remember where inventory was built.
Swing Trade Applications
- Acceptance above weekly VAH → trend continuation
- Rejection at prior POC → mean reversion
- Break and hold above HVN → expansion
Using Volume Profile With Options Greeks (The Real Edge)
Volume profile shows where trading occurred.
Options Greeks show how dealers must hedge risk.
Together, they explain why price behaves the way it does.

Delta + Volume Profile
Delta measures directional exposure.
- Heavy call delta near HVNs → dealer hedging dampens moves
- Heavy put delta below LVNs → downside accelerates
Rule:
HVNs absorb delta pressure.
LVNs amplify it.
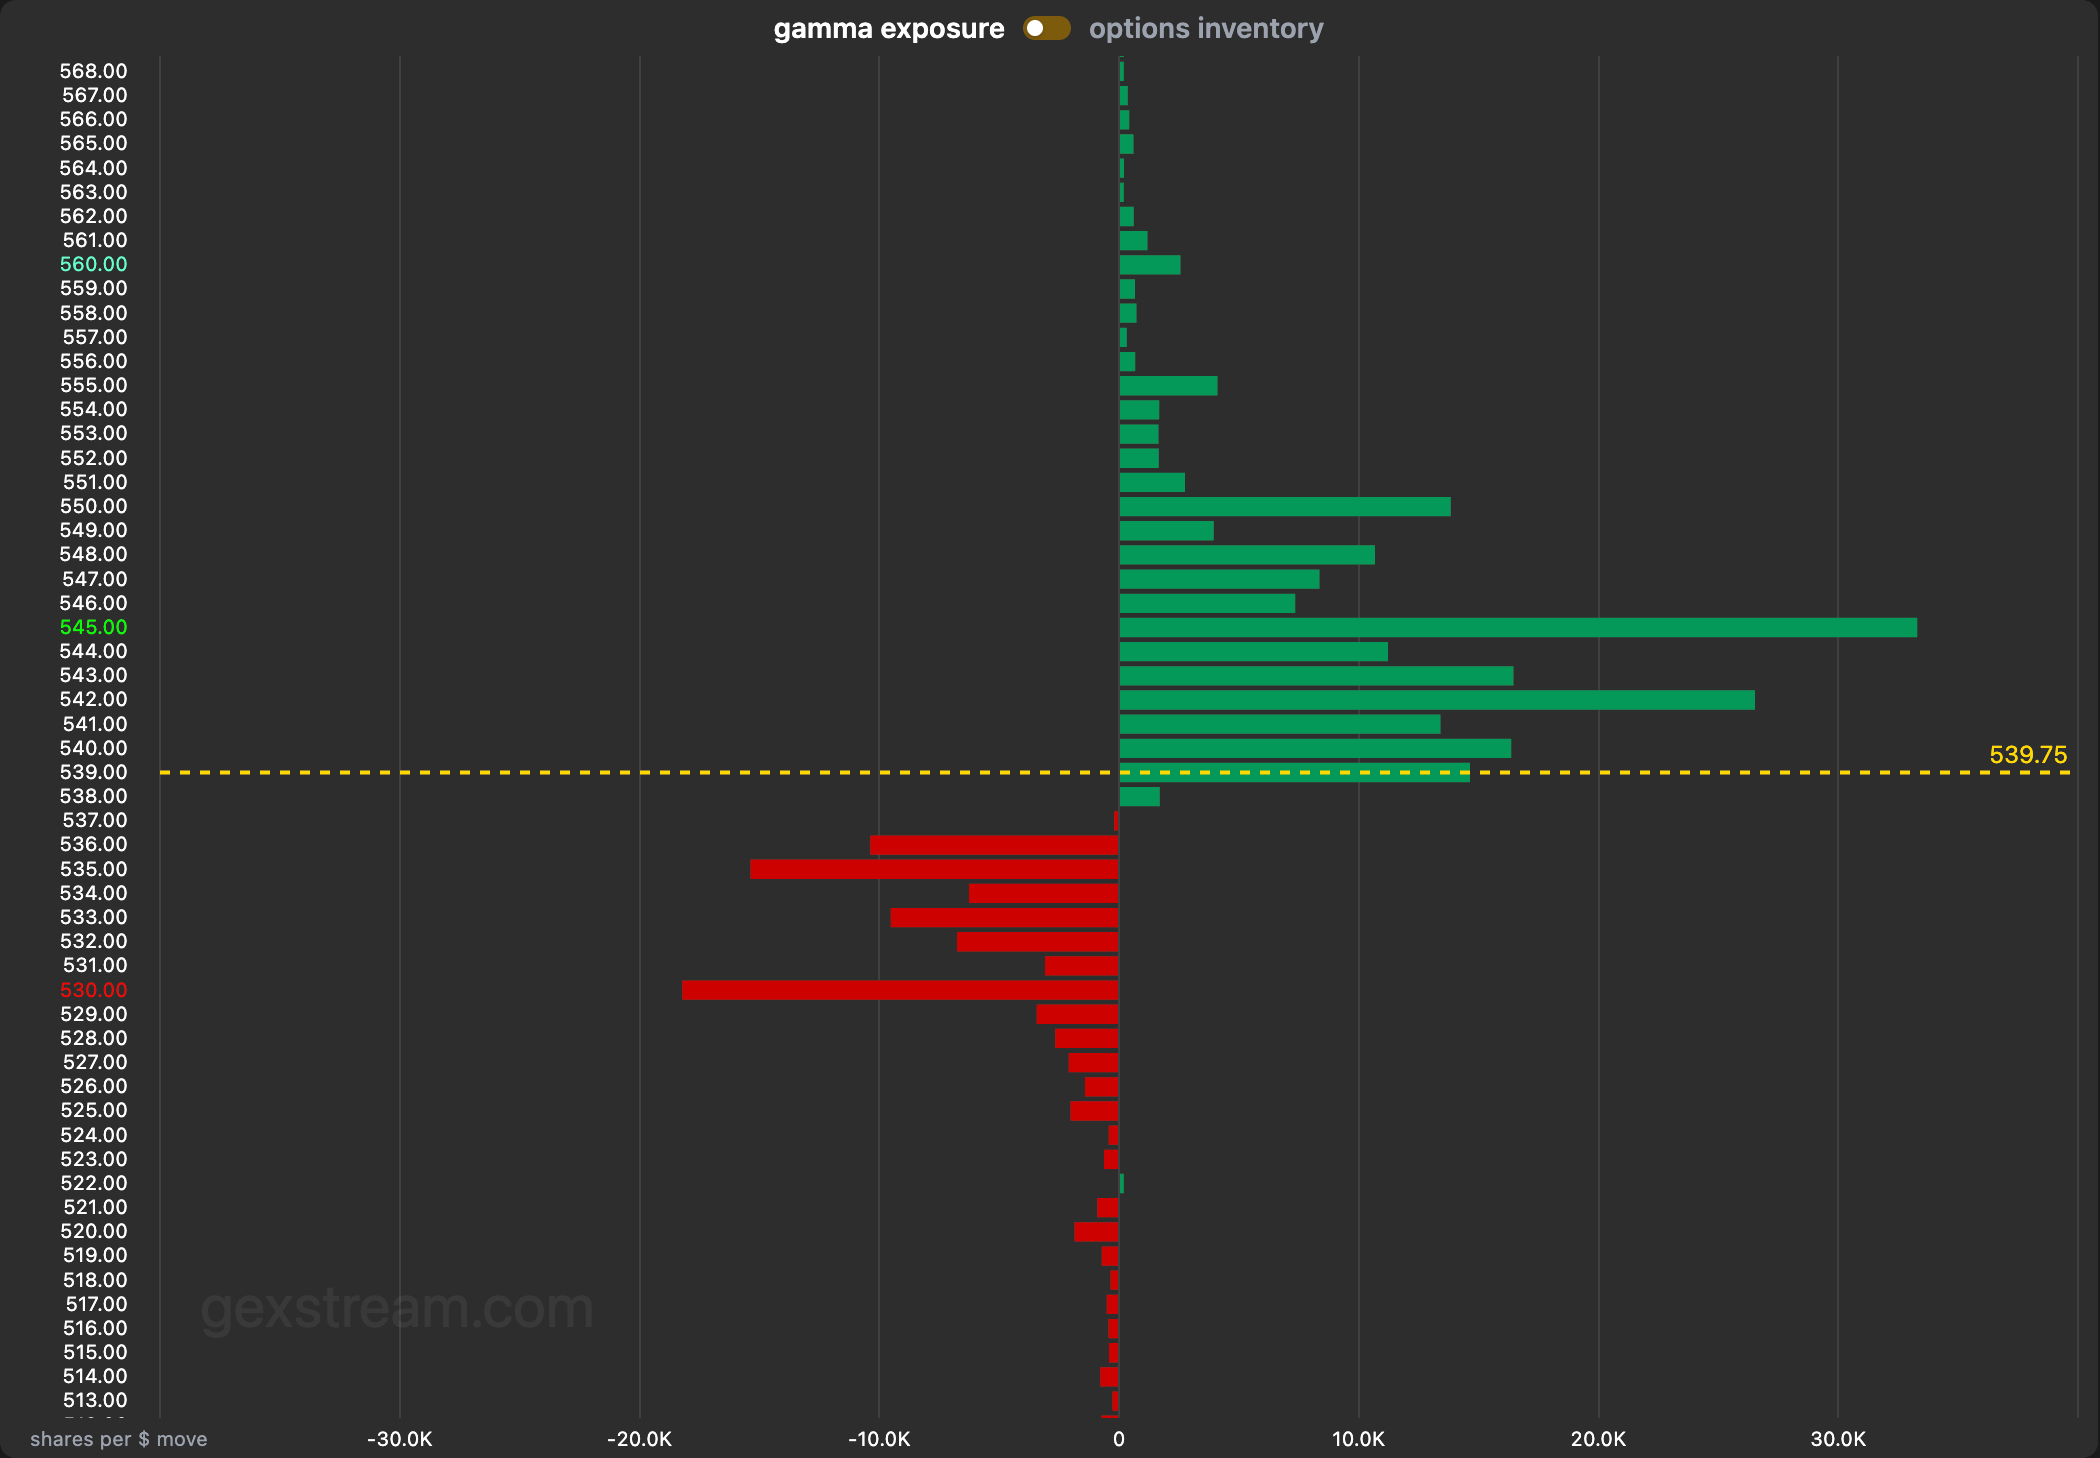
Gamma + Volume Profile (Critical)
Gamma determines speed and stability.
Long Gamma Environment
- Dealers hedge against price movement
- Mean reversion dominates
- Volume profile levels hold
Best Trades
- POC fades
- Value rotations
Short Gamma Environment
- Dealers hedge with price
- Momentum accelerates
- LVNs break violently
Best Trades
- Acceptance beyond value
- Expansion targets only
Never fade LVNs in short-gamma conditions.
Charm (Delta Decay) + Volume Profile
Charm reflects how delta decays over time, especially near expiration.
Effects
- Dealer hedges unwind
- HVNs weaken late in the session
- Afternoon directional drifts emerge
Practical Use
- POC reversion loses reliability late on expiration days
- LVN breaks become more meaningful into the close
Vanna + Volume Profile
Vanna links volatility to delta.
- Volatility compression at HVNs → price stabilization
- Volatility expansion through LVNs → momentum
Watch implied volatility behavior around key profile levels.
Theta + Volume Profile
As expiration approaches:
- Price gravitates toward high-volume, high-OI zones
- Pinning behavior increases
Breaks only occur when gamma flips or liquidity thins.
Open Interest (OI) + Volume Profile
Open interest shows where risk still exists, not where trades already occurred.
High-Probability Confluences
| Volume Profile | OI | Expectation |
|---|---|---|
| HVN + High OI | Magnet | Chop |
| LVN + High OI | Instability | Break |
| LVN + Low OI | Thin liquidity | Fast move |
Volume profile maps history.
Open interest maps future pressure.
A Professional Volume Profile + Options Framework
Step-by-Step Process
- Identify HVNs and LVNs (daily + anchored)
- Determine gamma regime
- Overlay open interest clusters
- Assess delta imbalance
- Execute:
- Fade value in long-gamma
- Trade acceptance in short-gamma
Common Volume Profile Mistakes
- Treating POC as support/resistance
- Fading LVNs
- Ignoring gamma regime
- Using volume profile without options context
- Overtrading inside balance
Why Volume Profile Works
Volume Profile doesn’t predict price.
It organizes where risk, liquidity, and agreement exist.
Options Greeks don’t predict price.
They explain how hedging pressure will react.
When combined, they provide:
- Structural clarity
- Directional confidence
- Risk-defined execution
This is how professionals trade with the market’s mechanics, not against them.